Shape |
-
Shape( points array, line color, [fill percent], [fill color] ) => creates a geometric shape, defined by and array of points {{l1,c1},{l2,c2}…..}, drawn in the specified color (default is black), and optionally fills the create shape with gray according to fill percent value.
Points array (array) : An array of numbers pairs, giving vertical and horizontal positions, for every point in the shape, the quantity of pairs is unlimited, allowing the creation of complex figures of any kind.
Line color (numeric) : informs the color of the surrounding line for the shape, constants from GRA.CH can be used in the form of GRA_CLR_… or any other RGB number (created with GraMakeRGBColor()) can be used.
Fill percent (numeric) : numeric value in the range of 0 to 100, indicating the amount of gray that should be used to fill the shape, the higher the number the darker will be the filling, a value between 5 to 20 will provide a gray area as a background, suitable for foreground text, or other data. Default for fill percent is 0 (none).
Fill color (numeric) : sets the color to be used to fill the shape, to use this option, you should set the the Fill percent to -1 (minus one), and the shape will be filled with the specified color instead of gray.
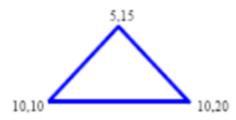
Example : oPdf:Shape( { {10, 10}, {5, 15}, {10, 20} }, GRA_CLR_BLUE) will create a blue triangle at the specified points.