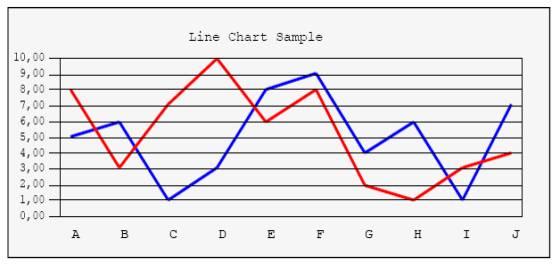
| • | LineChart({xPos, yPos}, {xSize, ySize}, data, data titles, chart title, colors ) => draws a line chart, at position init line, init col with size height, width, using the values in data array, for each position, a title in data titles is displayed. Multiple lines can be drawn, each one will have its color from the colors array. A title can be displayed at the top/center of the chart using the chart title parameter. See a sample at Charts.PDF |
yPos (numeric) : Vertical position of chart corner according to coordinate system.
xPos (numeric) : Horizontal position of corner to start drawing the chart.
ySize (numeric) : Height of box containing the chart.
xSize (numeric ) : Width of box containing the chart.
Data (array) : An array of arrays. Each sub array contains data values to be charted, one line will be drawn for each element of the sub array, using different colors for each line, automatic scaling will be calculated according to lowest/highest value present in all the array.
Data titles (array) : An array containing titles for each sub array in the data array, those titles will be displayed at the bottom of the chart.
Chart title (character) : Title of the chart, will be displayed on the center of the chart top row.
Colors (array) : An array of colors for the lines of the chart, should have as many elements as sub arrays in the data array. Conforms to color definition in GRA.CH or any valid RGB color.
Example : oPdf:LineChart( {100, 440}, {500, 240}, data, titu, "Line Chart Sample", { GRA_CLR_BLUE, GRA_CLR_RED } )
this will draw a line chart with blue and red lines. See Demo.PDF for more details.