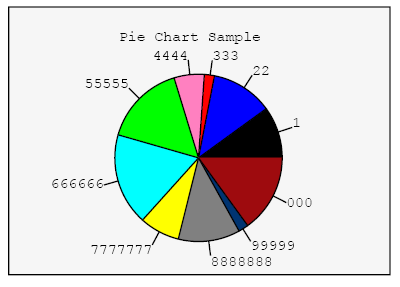
| • | PieChart( {xPos, yPos}, radius, data, data titles, chart title ) => draws a pie chart, at position init line, init col with size radius, using the values in data array, for each position, a title in data titles is displayed. Each pie “slice” will have its color. A title can be displayed at the top/center of the chart using the chart title parameter. See a sample at Charts.PDF |
yPos (numeric) : Vertical position of chart corner according to coordinate system.
xPos (numeric) : Horizontal position of corner to start drawing the chart.
Radius (numeric) : Height of box containing the chart.
Data (array) : An array of data values to be charted, one pie slice will be drawn for each element of the array, using different colors for each slice.
Data titles (array) : An array containing titles for each element in the data array, those titles will be displayed next to each slice in the chart.
Chart title (character) : Title of the chart, will be displayed on the center of the chart top row.
Example : oPdf:PieChart( {300,1500}, 100, data, titu, "Pie Chart Sample" )
This will draw a pie chart. See Demo.PDF for more details.